
By Ashlyn Bird
There are many different types of neurofeedback and various methods to measure brain activity. In this article, we will focus on sLORETA maps and how to interpret them.
At Butterfield Counseling and Neurofeedback, the first neurofeedback session includes two tests: one with eyes closed and one with eyes open. The data from these tests is compiled and presented in the form of brain maps. The following neurofeedback session is a brain map review session, during which the therapist reviews the brain maps with the client. Clients receive two types of maps: the eyes-closed sLORETA summary map and the eyes-open sLORETA summary map.
sLORETA summary maps measure the amplitude of brain waves—from Delta to Gamma—across the entire brain and compare them to age- and sex-matched normative averages. The data is presented using standard deviations of the bell curve and colored visuals.
____________________________________________________________________________
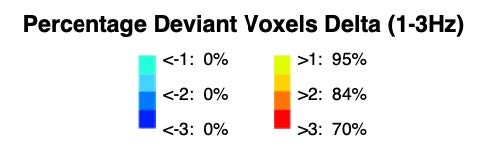
The percentages in this image represent the client’s activity compared to the average. To understand this better, we need to look at the bell curve.
____________________________________________________________________________
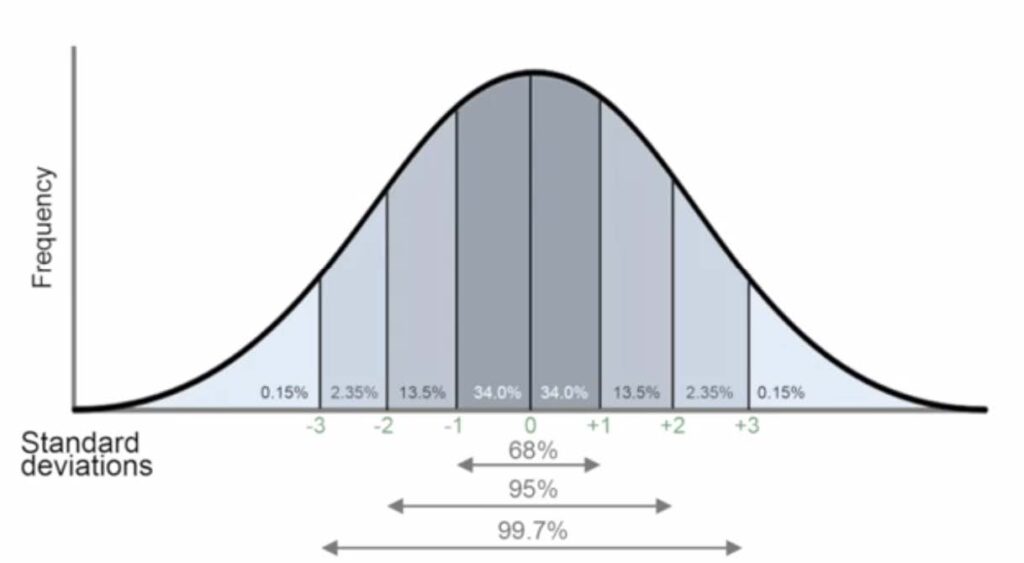
The centerline of the bell curve represents the average brain activity for individuals in a specific age and gender category. One line right of the center is a standard deviation above the average.
Two lines right of the center show two standard deviations above the average. Three lines right of the center represent three standard deviations above the average. This is the same for the lines left of the centerline, but they represent activity below the average.
____________________________________________________________________________
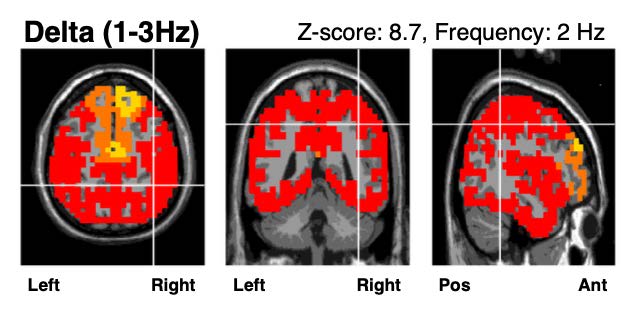
These maps provide three visual representations of brain activity from different angles for each brain wave, allowing for a more accurate portrayal of the recorded activity.
● The visual on the far left shows a top-down view of the brain, with the front of the head (face) positioned at the top of the image.
● The second visual is a view from the back of the head.
● The third visual is a view of the side of the head, where the front of the head (the face) is positioned on the right side of the image.
These pictures are provided for each brain wave, from Delta to Gamma. The colors seen in these pictures correspond to the key under the pictures that represent the activity from the average. Two white lines create a cross-hair over the area that has the most significant activity for that particular brain wave.
____________________________________________________________________________
On the right side of the third visual is a list named Brain Area, which tells you the area of the brain where activity outside of the average is found. The list under the name Function gives a brief description of the function that corresponds with the outlined brain area. Additionally, there are two links under the title, Online Information, that will provide more information on the functions of the outlined brain areas.
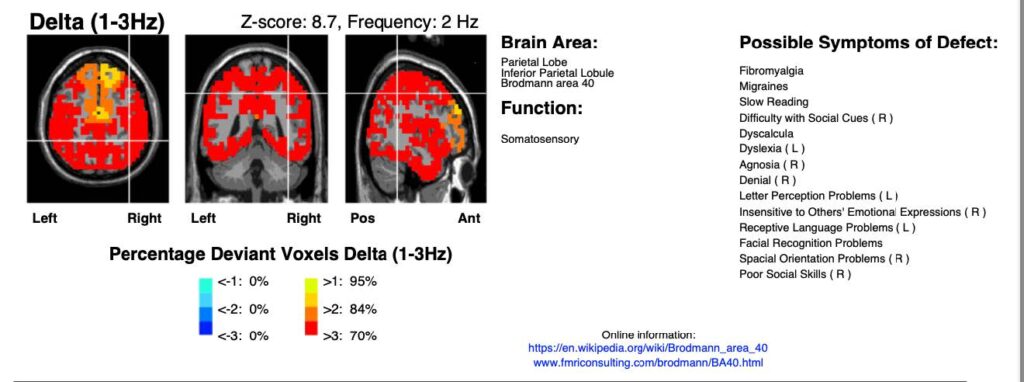
On the right-hand side of each brain wave section, there is a list titled Possible Symptoms of Defect. This is an auto-generated list of possible symptoms or issues that could be experienced by the client based on the recorded activity of that brain wave. Not all these symptoms will apply to the client; in fact, most won’t apply. It is best to talk with your therapist about the outlined activity seen in the maps and the symptoms you are experiencing to get a better understanding of the presenting issues.
____________________________________________________________________________
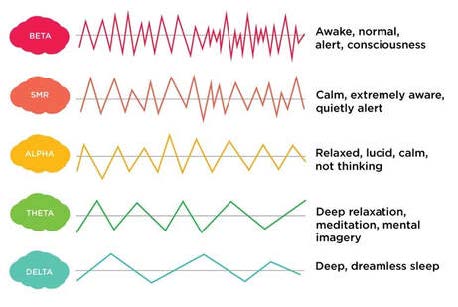
Brain Waves
Delta (1-3 Hz)
Delta is the slowest wave and is associated with natural healing, immune system promotion, and restorative sleep.
● Overactivity of Delta waves could be representative of brain injuries, learning problems, and severe ADHD.
● Underactivity of Delta waves could be representative of poor sleep, and the inability to rejuvenate the body and brain.
Theta (4-7 Hz)
Theta is associated with deep relaxation, meditation, mental imagery, inward focus, emotional connection, and creativity.
● Overactivity of Theta waves can be representative of ADHD, depression, hyperactivity, impulsivity, and inattentiveness.
● Underactivity of Theta waves can represent anxiety, poor emotional awareness, and stress.
Alpha (8-12 Hz)
Alpha is responsible for relaxed, calm, and quiet thoughts, and passive attention.
● The overactivity of Alpha waves is representative of daydreaming and inability to focus.
● Underactivity can represent anxiety, high stress, and insomnia.
Beta (13-34 Hz)
Beta waves are responsible for awakeness, alertness, problem-solving, mental focus, and memory.
● Overactivity of Beta waves is representative of anxiety/ stress, high arousal, and inability to relax.
● Underactivity of Beta waves is representative of ADHD, daydreaming, depression, and poor concentration.
sLORETA maps break Beta into three sections: LoBeta (13-15 Hz), Beta (16-20 Hz), and HiBeta (21-34 Hz).
● LoBeta waves are associated mostly with quiet, focused, introverted concentration.
● Beta waves are associated with an increase in energy, anxiety, and performance.
● HiBeta waves are associated with significant stress, anxiety, high energy, and high arousal.
Gamma (35-45 Hz)
Gamma is associated with peak concentration, high levels of cognitive functioning, information processing, learning, memory, attention, perception, and binding of senses.
● Overactivity of Gamma waves represents anxiety, high arousal, and stress.
● Underactivity of Gamma waves is representative of ADHD, depression, and learning disabilities.
sLORETA summary maps provide valuable insights into brainwave activity and can guide individualized neurofeedback treatment. While the data can appear complex, reviewing the results with a trained therapist helps connect brain function with symptoms and set goals for therapeutic progress.